
Introduction
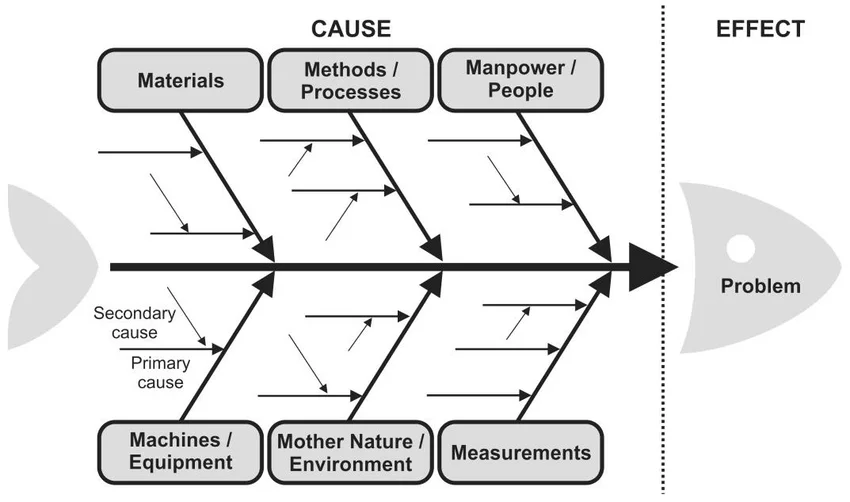
A cause and effect map, also known as a Fishbone diagram or Ishikawa diagram. It is a visual tool used to identify and analyze the potential causes of a specific problem.
The diagram is shaped like a fish skeleton. Represent the problem at the head of the fish and the possible causes branching out from the spine in the form of “bones.” The bones can be grouped into categories, such as materials, methods, people, equipment, and environment. It helps to organize and identify potential causes. Through this effective solutions can be developed and implemented.
How does a Cause and Effect Map work
Time needed: 10 minutes
Creating a Cause and Effect Map involves simple Steps:
- Brainstorm Potential Causes
Gather a team or individuals to brainstorm and list out all the potential causes that could contribute to the problem or event. It’s important to involve different stakeholders as they may have different perspectives and insights.
- Define the Problem or Event
Clearly define and write the problem or event that needs to be analyzed at the head of the diagram. This will serve as the starting point for the map.
- Identify Patterns in the Causes
Understand the Complexity of the Problem and analyze it to identify patterns and trends in the causes, and prioritize which causes to address first.
- Organize Causes into Categories
Group the potential causes into categories, such as materials, methods, people, equipment, and environment. This will help to organize and identify potential causes.
- Create the diagram
Draw the basic structure of the diagram, including the head of the fish and the spine. Then, add the bones representing the different categories of causes branching out from the spine.
- Add Specific Causes to the Diagram
Write the specific causes identified in the step on the bones of the diagram.
- Develop and Implement Solutions
Once the root cause has been identified, develop and implement effective solutions to address the problem or event.
- Continuously Review and Update
Continuously review and update the cause and effect map as new information comes in, this will help to identify new causes, and solutions.
- Finally, Solve the Problem
It is a great tool for problem-solving because it is easily understood by the team in a wide range of industries and fields, from manufacturing to healthcare to customer service.
Benefits of using a Cause and Effect Map
| Sr | Benefits | Details |
|---|---|---|
| 1. | Identifying root causes | The primary benefit of using a Cause and Effect Map is that it helps to identify the underlying, or root, cause of a problem or event. |
| 2. | Identifying patterns of the problem | This can help to prioritize which causes to address first and can also reveal interrelated causes that may have been previously overlooked. |
| 3. | Identifying areas for improvement | we can also use it to identify areas for improvement in processes or systems, which can lead to increased efficiency and effectiveness. |
| 4. | Facilitating problem-solving | It facilitates problem-solving by providing a structured approach to identifying and analyzing potential causes. |
| 5. | Provides a clear and holistic view | It helps to identify the cause of a problem and its impact on the whole process or system. |
| 6. | Improving communication | A Cause and Effect Map visually represents the problem and potential causes. This can help to improve communication and collaboration among team members. |
| 7. | Can be used in multiple fields | It is a versatile tool that can be used in a wide range of industries and fields, from manufacturing to healthcare to customer service. |
| 8. | Encouraging Creativity | The brainstorming process of creating a Cause and Effect Map encourages team members to think creatively. It also considers potential causes that may not have been initially apparent. |
| 9. | Collective Benefits | It encourages creative thinking, clear communication, and efficient problem-solving skills. |
Examples of Cause and Effect Map
These are just a few examples of how a Cause and Effect Map can be used in different industries and fields, to identify and understand the problem, and to develop effective solutions.
- Manufacturing: In a manufacturing setting, a Cause and Effect Map can be used to identify the causes of defects in a product. For example, a manufacturing company uses this Map to identify the causes of scratches on a product.
- Healthcare: A healthcare organization can use this Map to identify the causes of patient falls. The map could include categories such as patient factors, environmental factors, and staff factors.
- Service industry: A service industry like a hotel, can use a Cause and Effect Map to identify the causes of guest complaints about room cleanliness. The map could include categories such as housekeeping procedures, staff training, and equipment maintenance.
- IT: An IT organization can use a Cause and Effect Map to identify the causes of a system outage, which could include factors such as equipment failure, software bugs, and human error.
- Construction industry: Construction companies can use a Cause and Effect Map to identify the causes of delays in a project. The map could include categories such as weather, equipment failure, and labor issues.
- Agriculture: In the agricultural industry this Map identifies the causes of crop damage. Factors such as pests, weather, and soil quality are examples.
- Banking: Banks can use a Cause and Effect Map to identify the causes of customer complaints about account errors. Factors such as system errors, human error, and training are examples.
- Transportation: Transportation companies can use a Cause and Effect Map to identify the causes of late deliveries. It is caused by factors such as traffic, equipment failure, and driver error.
Best Usage Practices
- Clearly define the problem or event: Before creating a Cause and Effect Map, it is important to clearly define the problem.
- This is the starting point for the map to ensure that the map is focused and relevant.
- Involve a diverse group of stakeholders: Gather a team of individuals with different perspectives and skills to brainstorm and identify potential causes.
- Use clear and specific language: Use clear and specific language when identifying potential causes. This will help to ensure that the causes and address them effectively.
- Organize causes into categories: Organize causes into categories, such as materials, methods, people, equipment, and environment. It can help to identify patterns and trends to analyze the map and identify the root cause.
- Identify the root cause: Identifying the root cause of the problem or event is the most important step in creating a Cause and Effect Map. This requires a thorough analysis of the map by a team of individuals with skills.
- Develop and Implement effective Solutions: Once you identified the root cause, develop and implement effective solutions to address the problem. It’s important to test and evaluate the solutions and make necessary adjustments.
- Continuously Review and Update: Continuously review and update the Map as new information comes in. This will help to identify new causes, and it will also help to evaluate the effectiveness of the implemented solutions.
- Use it as a continuous improvement tool: Use it as a tool for continuous improvement, and use it for all your problem-solving processes.
By following these best practices, organizations and individuals can effectively use a Cause and Effect Map. So, we can identify and address problems, improve processes, and increase efficiency and effectiveness.
